
Finding out how much payments actually costs your business is deceptively difficult.
Each processor reports costs in its own way. One gives you every individual fee line while the next gives you a bundled percentage with no breakdown. And even when you get the numbers into one place, comparing them is misleading because each processor handles a different mix of transactions.
Without that clarity, you can't negotiate from a position of strength, route to the most cost-effective processor for different transaction types, or catch fee leakage before it compounds into notable revenue loss.
This guide covers how payment fees actually work, how to approach a cost analysis, where costs hide, and how to get the visibility to act on what you find.
Primer gives merchants a single view of costs across every connected processor, with the tools to act on what you find. Book a demo to see how it works.
How payment fees work
Before getting into cost analysis, it's worth defining what the costs in a payment actually are and how different pricing models work.
Every card transaction includes three categories of cost:
- Interchange fees are paid to the card-issuing institution (the customer's bank). These are set by the card networks and vary depending on the card type, region, and transaction details. A premium credit card from an overseas issuer will likely carry higher interchange than a domestic debit card.
- Scheme fees are paid to the card network itself (Visa, Mastercard, Amex). These cover the cost of using the network's infrastructure to process the transaction.
- Processor fees are what your PSP charges on top for actually handling the transaction.
Beyond these three, there may be standalone costs like account maintenance fees, settlement fees, chargeback fees, and currency conversion charges.
How you see these costs depends on your pricing model:
- Flat-rate pricing means the processor charges a single percentage on every transaction regardless of type. You pay the same rate whether it's a domestic debit card or an international premium credit card. The simplicity comes at a cost, however, as you're likely overpaying on cheaper transactions and have no visibility into the underlying fee components.
- Interchange-plus pricing (sometimes called interchange++) breaks the cost into its components: interchange + scheme fees + a fixed processor markup. This gives you transparency into what each part of the transaction actually costs, which is essential for meaningful cost analysis across processors.
Understanding which model you're on with each processor is the starting point for any cost analysis. If you're on flat-rate pricing with one provider and interchange-plus with another, comparing their costs requires different approaches.
How to conduct a payment cost analysis
When conducting a payment cost analysis, you want to understand your total cost per transaction across each processor and compare them.
In theory, this means pulling settlement reports from each PSP, categorizing the fees, and calculating your effective rate.
Here's how to approach it:
- Step 1: Pull your settlement reports. Download the settlement reporting from each processor you work with. This is where the raw cost data lives, including the fees charged against transactions over a given period. Keep in mind that processors use different names for these reports, and some provide multiple reports with different levels of detail.
For example, Stripe provides a Payout reconciliation report, Checkout.com has its Financial Actions Report and Settlement Breakdown Report, Adyen provides a Settlement Details Report, and Nuvei offers a Movement Report and Settlement Summary Report. - Step 2: Calculate your effective rate. Divide your total fees by your total processing volume for each processor. This gives you a single percentage that represents what you're actually paying, which is easier to compare than individual fee line items. But treat it as a starting point, not a verdict on which processor is more expensive.
Costs can vary significantly depending on the payment mix each processor handles. One processor may process more credit card or cross-border volume, for example, while another may see higher levels of refunds or disputes. A higher effective rate can therefore reflect a more expensive transaction mix rather than higher processor pricing. - Step 3: Compare across processors. Once you're working with two or more processors, each reporting in its own format and handling a different mix of transaction types, a meaningful comparison requires normalizing the data first. Many growing merchants are at this stage, and it's where manual analysis starts to break down.
The above is what’s involved when you don’t have a unified intelligence solution like Primer. Keep reading to learn more about how Primer can greatly simplify this process.
Payment costs that don't show up on your settlement report
The costs above at least appear somewhere in your reporting, even if they're hard to compare. The ones below are harder to catch because they're either invisible in standard reporting or only become clear after the fact.
- FX embedded in currency conversions. When your PSP converts a payment to your settlement currency, the conversion rate includes a markup. But because the funds arrive net, the FX cost never appears on your settlement report. Even if some processors include the FX rate at which they converted. This FX rate incorporates a markup that isn't explicitly stated. The only way to see it is to compare the rate used against the mid-market rate at the point of conversion, and most merchants don't.
Learn more: How to reduce FX fees for businesses
- Declined authorization fees. Some processors charge a fee every time a payment is attempted, even if it’s declined. A processor with a lower headline rate can end up more expensive if you have a high decline rate and didn't know you were being charged per decline.
- Volume tier adjustments. Some processors apply tiered pricing where your rate drops as monthly volume increases, but settlement reports only reflect the default tier. The processor checks at month-end whether you qualified for a discount and applies it manually afterward, so the report never shows what you'll actually pay.
- Scheme fee changes. Visa and Mastercard periodically update their scheme fees, and the increases filter through to your costs. Unless you're actively tracking these updates, the increases go unnoticed and compound over time.
Why payment cost analysis is harder than it looks
1. Every processor reports differently
Some processors give you a detailed breakdown of every individual fee on every transaction. Others agree on a flat percentage and give you no transparency into the underlying cost components.
To compare costs across processors, you first have to put the data into a consistent format, which means manually reconciling reports with different structures, column headers, and levels of granularity. For a payments manager already optimizing for authorization rates and managing fraud, doing this on a monthly basis across four or five processors is a significant time commitment.
2. You're not comparing apple to apples
Even when you get the numbers into one place, a direct comparison can be misleading.
Each processor typically handles a different mix of transactions: more international cards versus domestic, more credit versus debit, more APMs versus card payments. On interchange-plus pricing, these variables directly affect cost. International cards carry higher interchange than domestic ones. Credit cards cost more than debit. APMs have entirely different fee structures. A processor that appears more expensive on a per-transaction basis might simply be handling a more expensive mix of transactions.
This means a headline comparison of "Processor A costs 2.1% and Processor B costs 2.4%" can be actively misleading if Processor B is handling more cross-border premium credit card transactions while Processor A is processing mostly domestic debit.
To get a meaningful comparison, you need to compare the same transaction types across processors: credit card with Processor A versus credit card with Processor B, in the same region, at the same transaction value. Normalizing your data to that extent is difficult to achieve manually.
You must also take into account performance of the processor. Cheaper cost rate combined with a significantly reduced authorization rate could end up "costing" more than an expensive processor with much better conversion/authorization rates.
3. Fee types vary between processors
Beyond the core interchange, scheme, and processor fees, each PSP has its own set of standalone charges. Some processors charge for declined authorizations while others don't. Some apply account maintenance fees, settlement fees, or minimum monthly charges.
These differences mean a processor that looks cheaper on headline rates can end up more expensive once you account for the fees that only surface after you go live. As you go multi-PSP, what you assume would be edge cases turn out to be significant line items in the form of fees you've never seen before because your previous processor didn't charge them. They show up on your settlement report and, unless you're actively looking, you might not notice them compounding month over month.
How Primer helps you understand and act on payment costs
Primer started as a payment orchestration platform, giving merchants a single integration to connect, route, and manage payments across multiple processors. But from the beginning, the vision was broader, as we had a goal to build the infrastructure layer that sits across a merchant's entire payments journey.
That's why Primer now extends beyond orchestration into reconciliation, cost management, and FX. The same platform that routes your payments also ingests your settlement data, normalizes it, and gives you the tools to understand what each transaction is actually costing you.
Here's what that means in practice.
One consistent cost view across every processor
Your cost data is scattered across processor dashboards that were never designed to be compared. Reconciliation fixes this by ingesting settlement reports from each processor and normalizing them into a single format: same columns, same fee classifications, same structure.
Costs Overview sits on top of that normalized data. You can compare costs using different parameters, including per processor and per region, with costs shown as both absolute amounts and as a percentage of total payment volume. This means a processor handling 10x the transactions doesn't look artificially expensive in absolute terms.
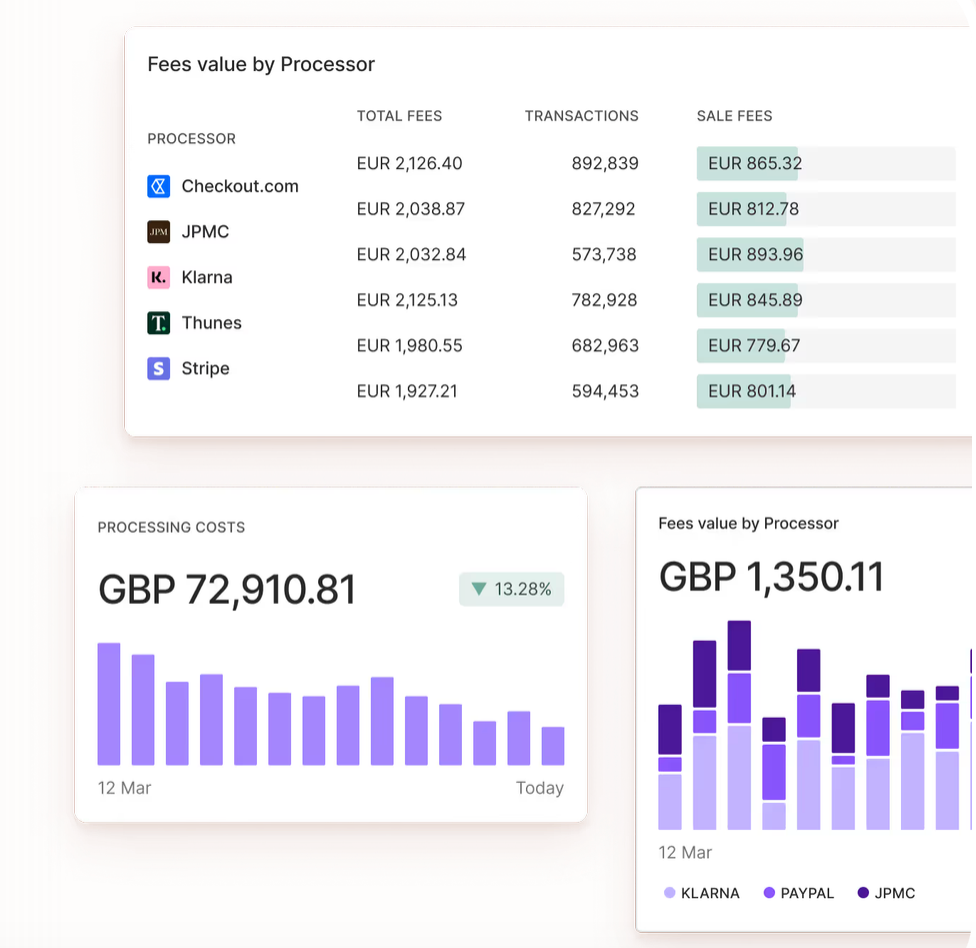
The dashboard breaks costs down into interchange, scheme, and processor components. When one processor is more expensive, you can see exactly where the difference is coming from, whether it's the processor's markup, higher interchange on certain card types, or scheme fee changes that have filtered through.
FX visibility and control with Global Accounts
FX is the one cost that doesn't appear on settlement reports, and most orchestration platforms don't address it at all. Primer does.
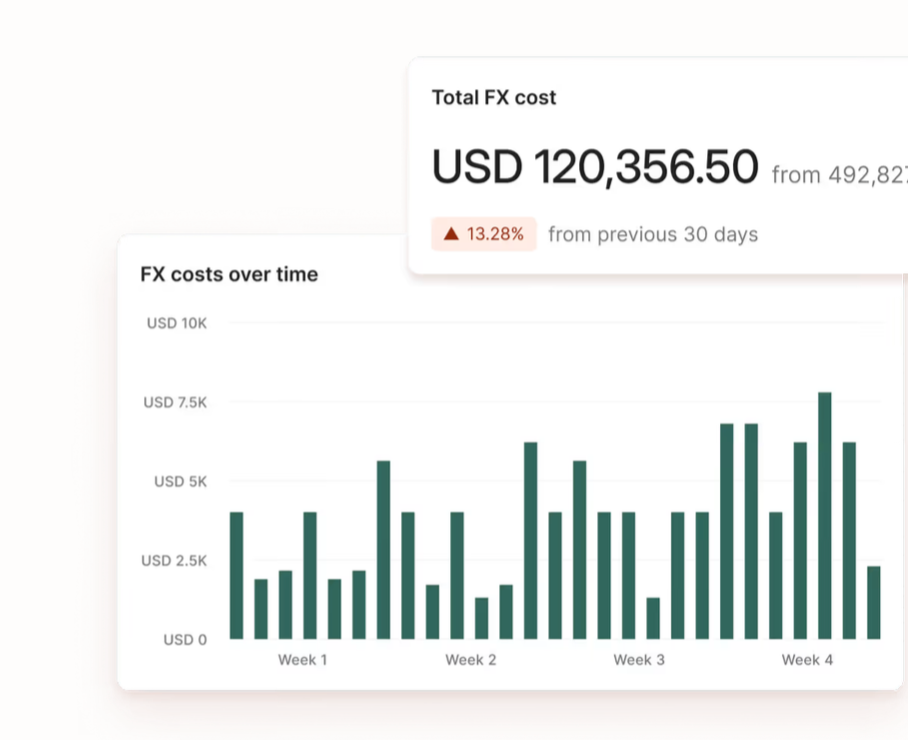
Global Accounts gives you the ability to collect and hold funds in 16+ currencies, converting on your own terms rather than absorbing embedded PSP conversion markups at settlement. This turns FX from a hidden cost embedded in every international transaction into a deliberate decision that your finance and treasury teams control.
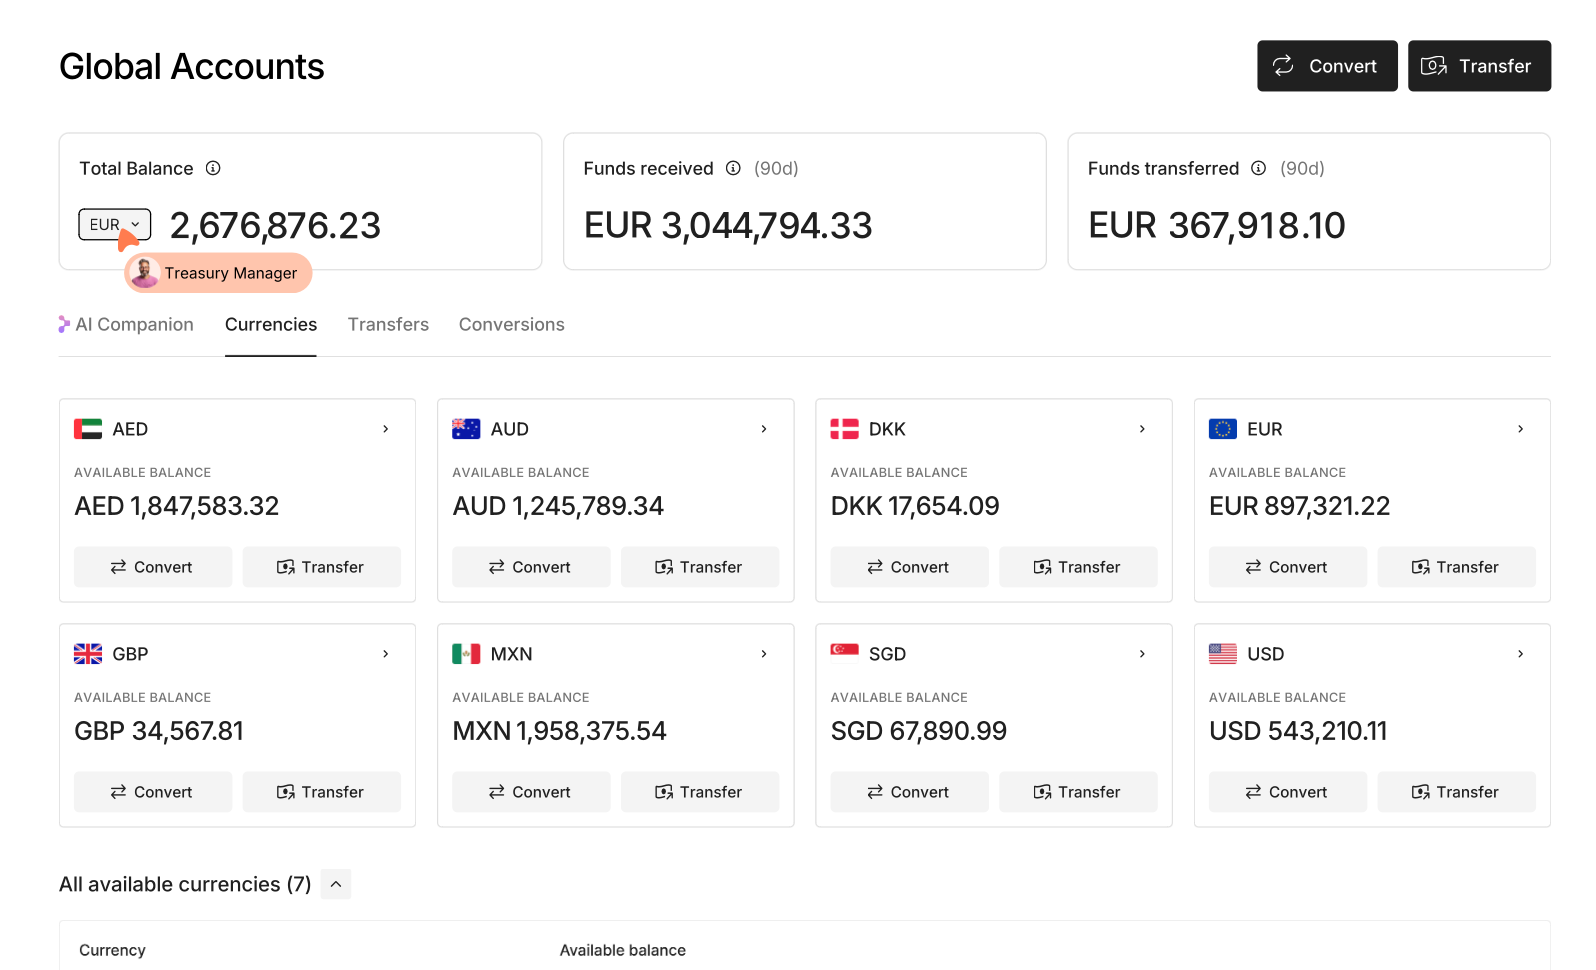
See what every transaction is costing you across each processor with Primer
Payment cost analysis shouldn't require downloading reports from five different dashboards, normalizing the data manually, and still not being sure whether you're comparing like for like.
Primer gives you a single view of costs across every connected processor, normalized into one format, with the ability to break down where costs are coming from and the routing tools to act on what you find.
Book a demo to see how Primer's Reconciliation, Costs Overview, and Global Accounts work together to give you full visibility into your payment costs.
Frequently asked questions (FAQs) about payment cost analysis
What is a payment cost analysis?
A payment cost analysis is the process of understanding the total cost of processing payments across your providers. This includes core transaction costs such as interchange fees, scheme fees, and processor markups, as well as additional charges such as settlement fees, account fees, dispute and chargeback fees, declined authorization fees, and FX costs.
By analyzing these costs alongside your transaction data, you can understand what different payment types and processors are actually costing your business and identify opportunities to reduce costs without negatively affecting payment performance.
Why is it so hard to compare payment costs across processors?
Comparing payment costs across processors is difficult because each payment processor reports in a different format, with different fee classifications, pricing structures, and levels of detail. On top of that, each processor typically handles a different mix of transaction types, payment methods, and transaction amounts, which directly affects transaction costs.
A meaningful comparison therefore requires normalizing the data and comparing the same transaction types across providers. Industry benchmarks can provide useful context, but your own transaction mix and payment data will give you a much more accurate picture of what each processor actually costs your business.
What payment fees are commonly overlooked?
A commonly missed cost is FX, which is embedded in currency conversion rates at settlement and doesn't appear on standard reports. Other frequently overlooked transaction costs include declined authorization charges, volume tier adjustments, scheme fee changes, account fees, and other indirect costs that may sit outside a processor's headline pricing.
These costs can add up over time, so looking beyond advertised payment processing fees is essential when assessing the true cost of your payment technology and provider setup.
How does FX affect my payment costs?
When a PSP converts a payment from a local currency to your settlement currency, the conversion rate includes a markup. Because the funds arrive net, the cost is invisible unless you compare the rate used against the mid-market rate.
At scale, this can be one of the largest hidden costs in the payment stack and can have a meaningful financial impact on cash flow and liquidity, particularly for businesses processing significant volumes across multiple currencies.
Do different payment methods have different costs?
Yes. The cost of accepting a payment can vary significantly depending on the payment method, market, transaction amount, and provider. Card payments, digital wallets, PayPal, and other alternative payment methods can all have different pricing structures and transaction costs.
This is why comparing providers based on a single headline rate can be misleading. Looking at transaction data by payment method gives you a clearer view of where costs are coming from and which options are most cost-effective for your business.
Can I reduce payment costs without switching processors?
Yes. Cost optimization doesn't require replacing your processors. With the right visibility, you can reroute specific transaction types to the most cost-effective provider, negotiate from a stronger position using payment data to back up your case, and catch fee leakage, such as FX markups or unexpected standalone charges, before it compounds.
A cost-benefit analysis can also help you weigh potential savings against performance factors such as authorization and fraud rates, so routing decisions improve costs without creating a negative financial impact elsewhere in the payment journey.
%20(1).png)